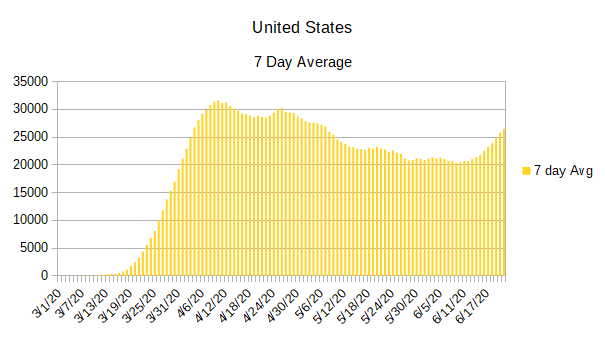
While I am finishing up the individual state charts for Covid-19 infections for the United States, there is something that I find both interesting and disturbing. It has now become obvious that the United States is no longer on a downward trend on the daily covid-19 infections. While the United States isn’t gaining infections exponentially, it has definitely started an upward trend.
The best way to see the change is to look at a 7 day average of the daily infection rates.
As you can see, sometime around June 11, 2020 the 7 day average began to change directions, but it was only in subsequent days that we could be sure it wasn’t just a short-term change.
I must admit that I liked the way that it looked when all the states were put in a list that was organized by their number of normalized daily infection rates. So, I’m going to do it again.
As you can see, there are a lot of changes from last week. While California still has the worst normalized daily infection rate, Texas moved up to the number two slot. Illinois, New York, and Virginia have each regained enough control of their infections that all three dropped out of the top five. They were replaced by Florida, Arizona, and North Carolina.
The five states with the lowest normalized daily infection rates remain the same even if some of them have changed position.
California
2,813
Texas
1,665
Florida
1,262
Arizona
1,078
North Carolina
1,057
New York
954
Illinois
946
Virginia
764
Georgia
732
Maryland
698
Pennsylvania
526
Tennessee
514
New Jersey
500
Louisiana
440
Minnesota
429
Alabama
424
Ohio
416
South Carolina
408
Massachusetts
405
Indiana
396
Arkansas
341
Wisconsin
340
Utah
329
Iowa
326
Washington
298
Michigan
288
Mississippi
283
Colorado
221
Missouri
214
Kentucky
211
Nebraska
204
Connecticut
199
Nevada
169
New Mexico
159
Oklahoma
109
Kansas
97
Oregon
84
Rhode Island
84
District of Columbia
78
South Dakota
65
New Hampshire
55
Delaware
53
Idaho
42
North Dakota
37
Maine
34
West Virginia
19
Alaska
14
Vermont
12
Wyoming
9
Montana
5
Hawaii
4
One thing that doesn’t show up in the above list is some of the dramatic increases that are happening in some of the individual states. In order to see that, you have to look at the graphs below. While the graphs don’t make it as easy to compare one state to the others as the above list does, it does make it easy to see how each individual state is doing over time.
I want to start by simply listing the states and the number of normalized daily infections each state has. The normalized daily infections is a lagging indicator, but it has the advantage of smoothing out the infection rate and making it much easier to determine how the infections are proceeding in each state.
I have been using the normalized daily infection count as a sort order to make it easier to tell which states have the most daily cases of Covid-19 and which have the least. My hope is that by putting the states in this order, along with the number of infections as of the last calculation on normalized infections, it will provide a view that is easier to understand than looking at the charts alone.
If you are curious as to where these numbers appear on the individual charts, they will be the last line recorded in blue.
Since I am listing the states in descending order of their normalized daily infection rate, I am going to return to publishing the state graphs in alphabetical order.
California
2,548
Illinois
1,405
Texas
1,299
New York
1,291
Virginia
1,068
Maryland
882
New Jersey
813
Massachusetts
791
Florida
786
North Carolina
763
Pennsylvania
652
Georgia
628
Minnesota
567
Arizona
565
Ohio
499
Alabama
452
Indiana
445
Wisconsin
433
Tennessee
410
Louisiana
365
Michigan
353
Iowa
326
Mississippi
308
Colorado
302
Nebraska
277
Washington
268
Connecticut
263
South Carolina
256
Utah
209
Arkansas
205
Kentucky
190
Missouri
188
New Mexico
132
Rhode Island
125
Nevada
120
Kansas
104
District of Columbia
94
Delaware
92
Oklahoma
73
New Hampshire
66
South Dakota
65
Oregon
48
Maine
38
West Virginia
35
Idaho
35
North Dakota
25
Wyoming
10
Alaska
8
Montana
5
Vermont
4
Hawaii
1
And now we will take a look at the individual graphs of each state.