I’m going to do something a little bit different with this week’s data. Instead of presenting the states in alphabetical order, I’m going to present them in the order of the largest number of daily cases reported for each state to the smallest number of daily cases reported. This should make it easier to see where the problem states are since the higher the number of normalized daily infections, the higher the state will be on the list.
You might have noticed that I am using normalized daily infections instead of reported daily infections for a sorting criteria. While it might not matter in some states, other states have gaps in their reporting data. Some days they might report zero cases and other days they might have huge numbers. Because of this reason, I had to have some way to consider the number of cases expected per day instead of the cases actually reported. Since the normalized daily infections already estimates infections per day — even if it lags by two weeks — I decided to use it as the sorting criteria.
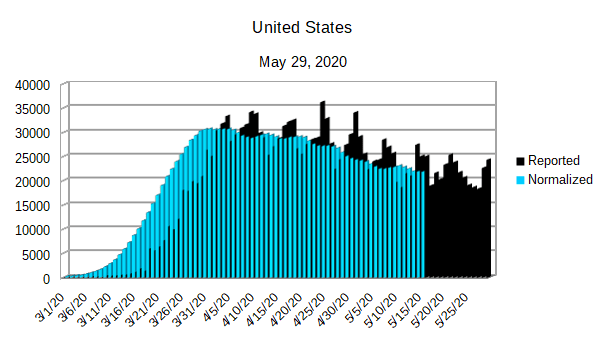
From a perspective of the entire United States, the daily infections still seem to be trending down. That said, it looks like the curve is going down less than it has been in recent weeks. If this turns out to be the case, then we might be leveling off to a steady background infection rate that could continue through the summer and into fall. While I am not a medical professional, that wouldn’t seem to be all that surprising considering what I have read from infectious disease researchers. When a novel (never having existed before) infection becomes a pandemic, there is no natural resistance to the disease and therefore there are so many people susceptible to the disease that herd immunity doesn’t initially come into play. The means that the infection can spread even in less-than-ideal conditions. And with how easy covid-19 spreads from person to person — at least in ideal conditions — it might not go away through the summer even if it is more of a seasonal infection.
This brings to mind a second thing I have been watching out for. It is possible that, because of the warm and humid weather, covid-19 is being kept partially in check through the late spring, summer, and early fall. If that turns out to be the case, then when conditions are again right, we can expect a return to geometric growth unless we take drastic actions to keep the spread in check.
The evidence for seasonal outbreaks of covid-19 is strengthened by the fact that the worst outbreaks are now happening in the southern hemisphere as they go through fall and into winter. On the other hand, the places where covid-19 are spreading geometrically are also places where people are packed together, medical assistance is limited, and governments haven’t significantly tried to reduce spread beyond a few targeted measures.
While it is still too early to determine the seasonal strength of covid-19, it is something that needs to be watched closely.
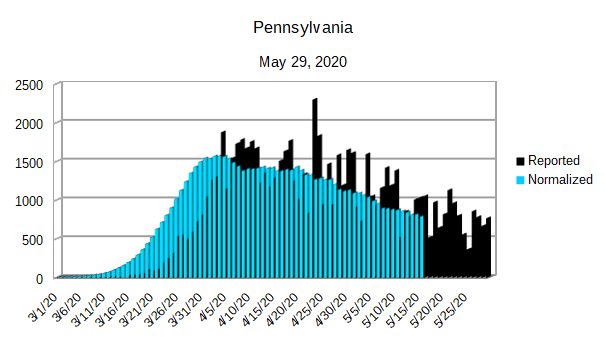
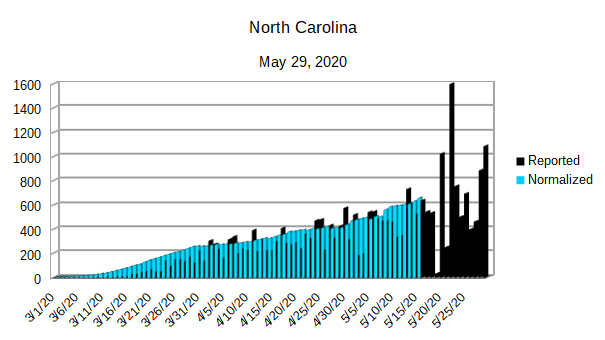
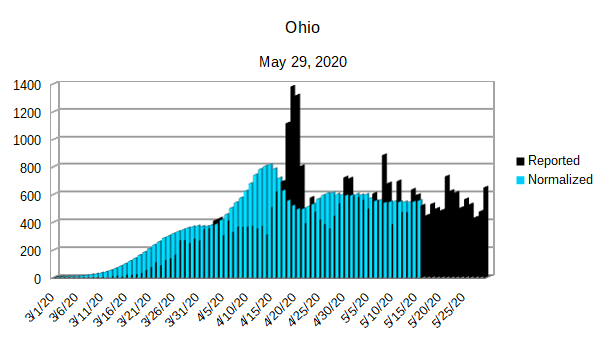
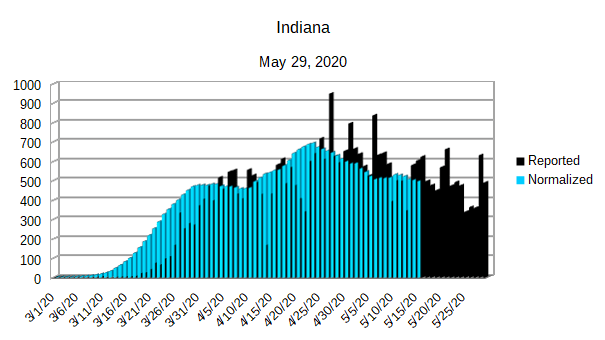
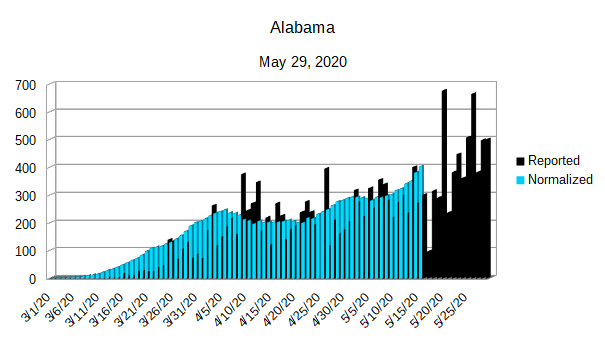
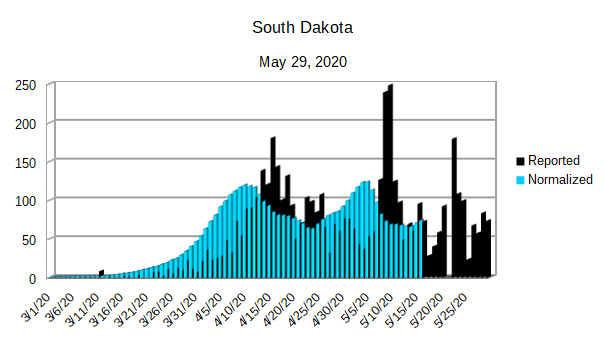
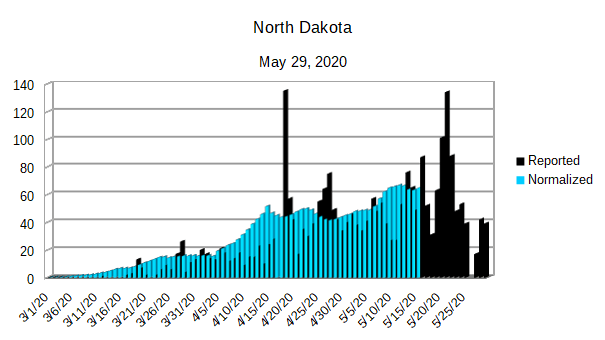
As for the individual states of the United States, there are a few things that stand out when I placed the states in descending order of daily infections. One thing in general is that the states that have migrated to the top are list have never really got their covid-19 infections under control. While it is true that none of those states are on an exponential curve, they also haven’t managed to significantly bring down their daily infections except for a few states that really stand out for their improvements.
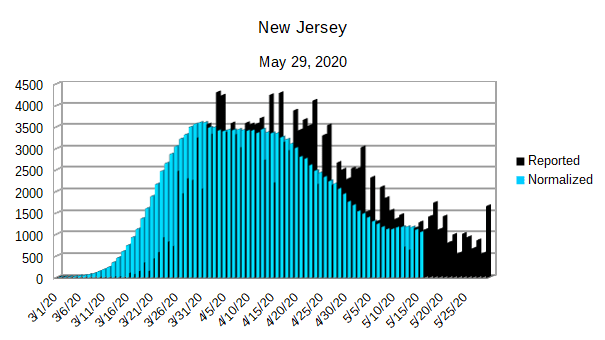
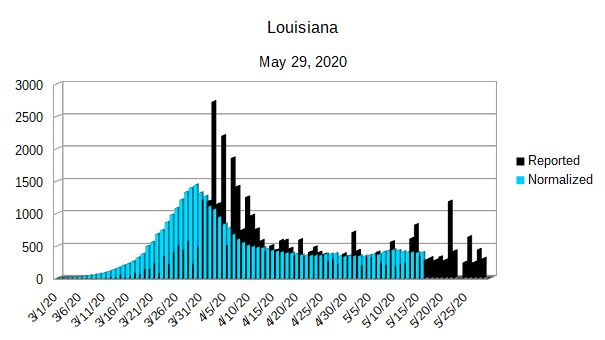
As for the states that are at the top of the list and have brought down their daily infections, it only serves to show just how severe the initial infections were in those states. New York and New Jersey have significantly reduced their daily infections yet they are still struggling with around 1000 infections per day.
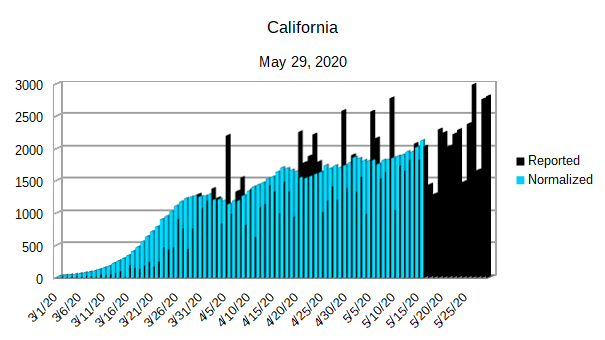
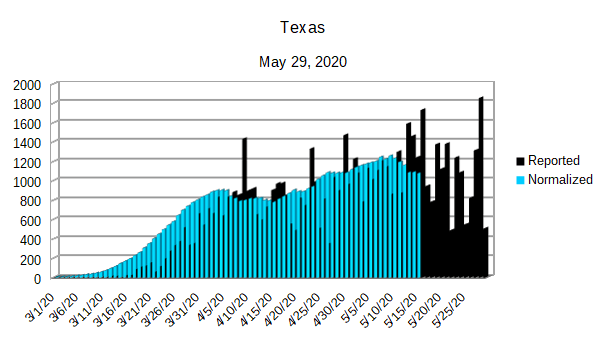
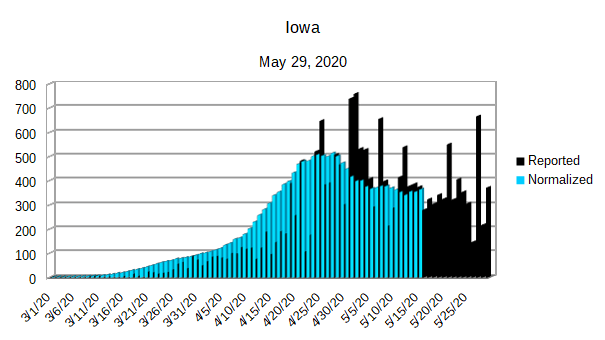
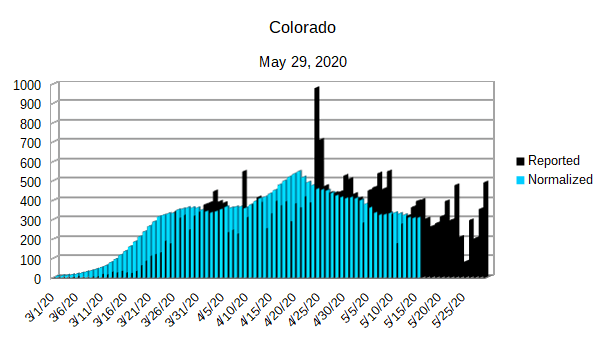
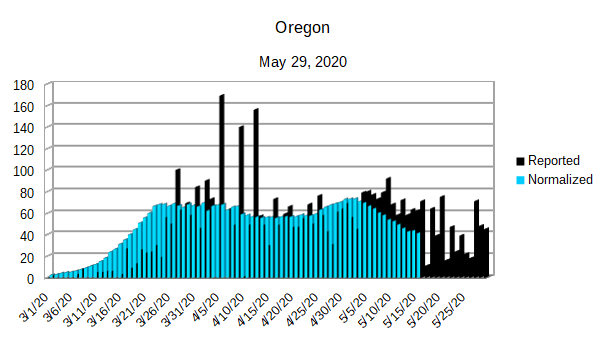
For the most part, the middle of the group of states have either reached their peak and began to slowly lower their daily infection rates, or they have very slowly rising infection rates.
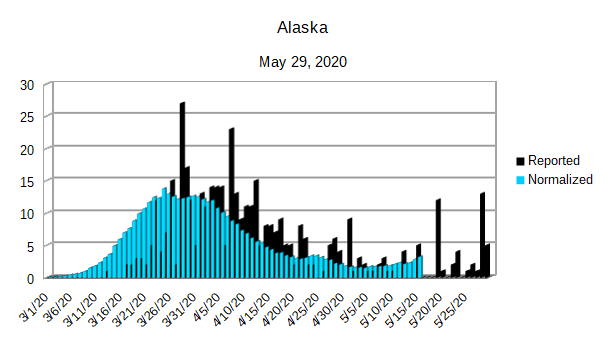
At the bottom of the list, the states that have done the best have generally had very low infection rates as well as reaching their peak and reducing their infections. Most of the states at the tail end of the list are also low population states or have geographically limiting features that helped them control the flow of people through their state like Hawaii.
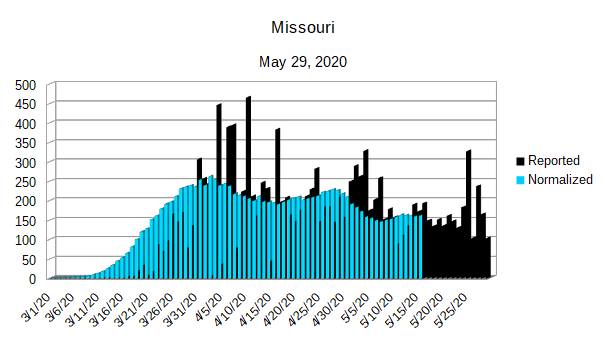
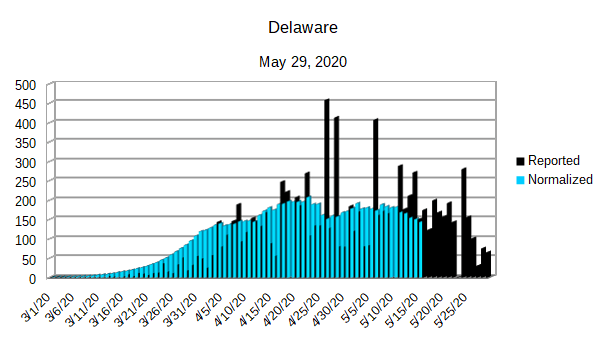
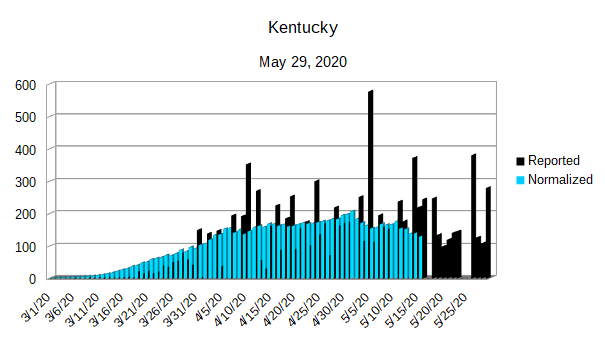
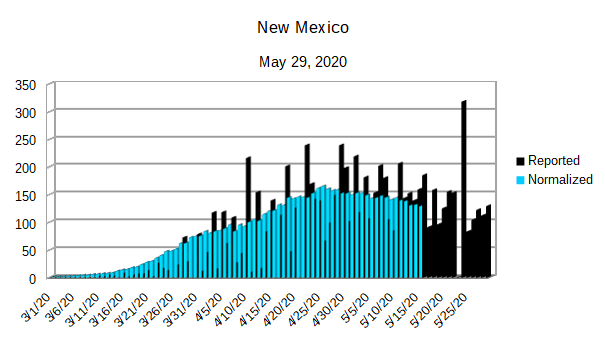
So here are the current outbreaks by state (including the District of Columbia as its own entry) in the United States sorted in order.