While I am finishing up the individual state charts for Covid-19 infections for the United States, there is something that I find both interesting and disturbing. It has now become obvious that the United States is no longer on a downward trend on the daily covid-19 infections. While the United States isn’t gaining infections exponentially, it has definitely started an upward trend.
The best way to see the change is to look at a 7 day average of the daily infection rates.
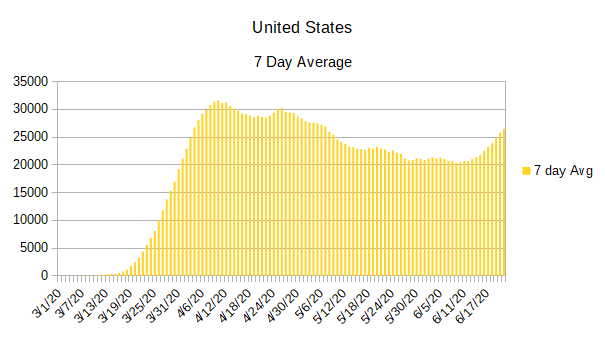
As you can see, sometime around June 11, 2020 the 7 day average began to change directions, but it was only in subsequent days that we could be sure it wasn’t just a short-term change.
The states that are driving the increase in the daily infection rates fall into two groups. The first group has been steadily increasing in a linear progression for quite some time. Examples of states that fall into that category would include states like California. But it is the second group of states that has caught my attention today.
The second group of states has shown rapid increases over the last week or two. Plenty of them have set highs for their state daily infection rates, and most of them are showing signs of potentially returning to exponential growth if the trend continues.
Here are the states in the second group
Arizona:
While the daily infection rate has been growing in Arizona for a while, it’s growth curve is giving no indication of slowing.

The next state that I am watching is Florida. While they seemed to have their daily infections under control up to about the end of May; since then, their daily infection growth has grown by a staggering degree.

The next state I am watching is Georgia. While I debated whether to include them in this group since they have been on a plateau, their steady growth over the last month has caught my attention and helped me decide to include them here.

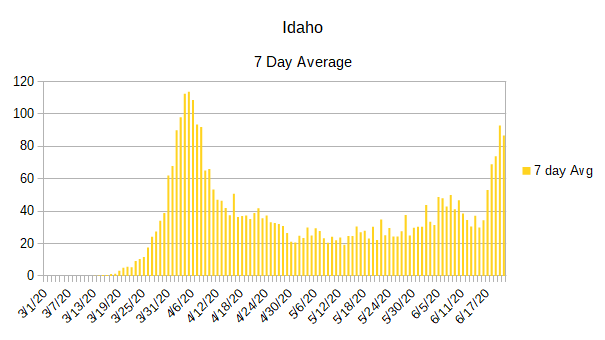
Idaho itself isn’t a big contributor to the overall United States totals, but their spike in recent days, combined with the potential to begin exponential growth, caused me to include them on this list.
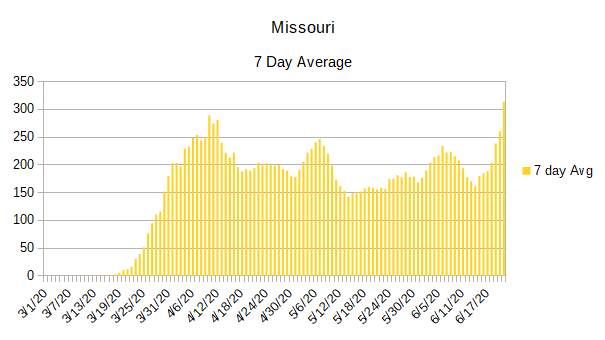
Missouri is another state that has been on a plateau since they initially broke their exponential curve. Over the last couple of weeks, however, they have experienced incredibly fast growth coupled with setting new daily highs. That was the reason that I included them on this list.
Since roughly the end of May, Nevada has been on a steady daily infection climb with no indication that they are slowing down. Tripling their daily infections since the end of May was enough to include them on this list.

Oklahoma had appeared to be a success story since breaking their initial exponential growth early in the cycle. They were so successful that Donald Trump decided to use Oklahoma as an example and stage his return to political rallies in the state. But before he even had a chance to hold the rally, Oklahoma was already showing warning signs of the worst outbreak it has had to date. And most worrying, it could easily be on an exponential growth pattern.

South Carolina is another state that had been on a daily infection plateau since breaking their initial exponential growth. They didn’t seem to quite make it until the end of May before their growth took off again.

Texas has been growing rapidly. Toward the end of may they started increasing and reaching new daily infection rate highs. Then, in what appears to be the first week of June, their daily infection rates really ramped up. They currently have about 3,500 infections per day.

And finally there is Utah. They are another state that has a rapidly increasing infection rate. While their infection rate has reached about 450 per day, if it continues increasing at its present rate, it will be a major contributor before long.

